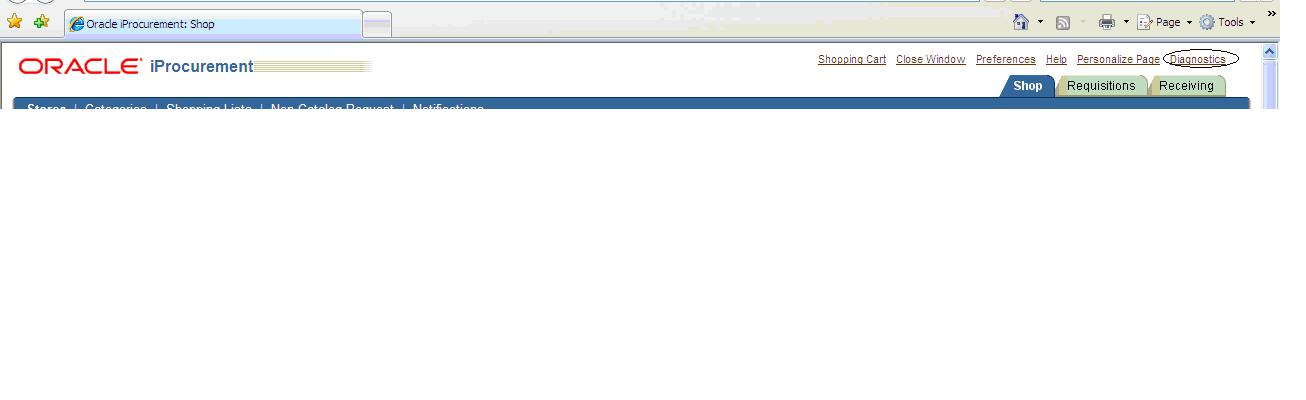
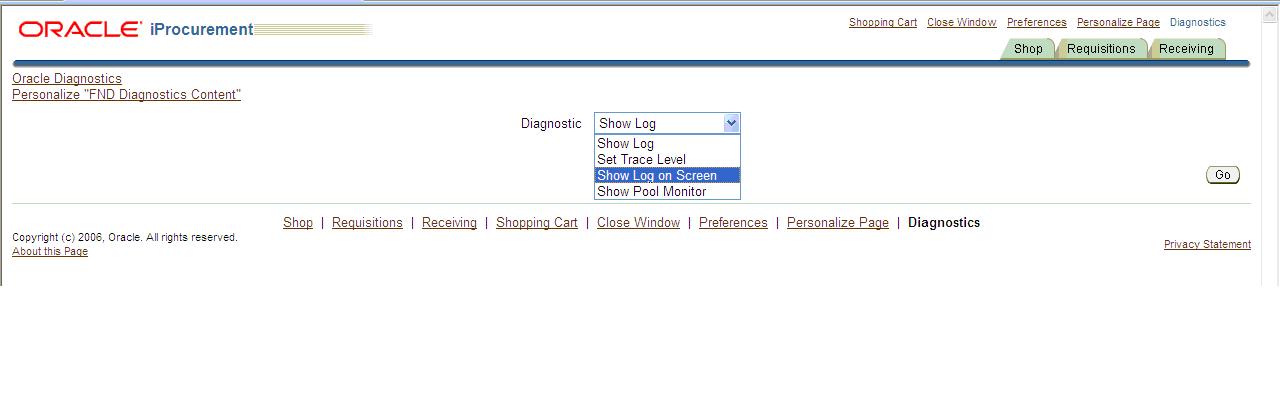
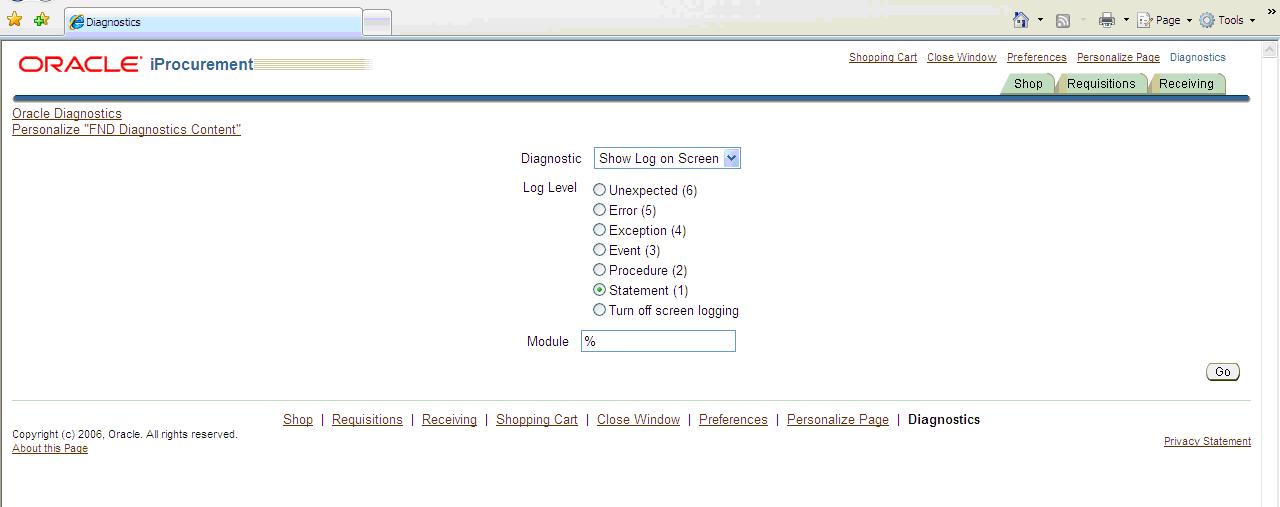
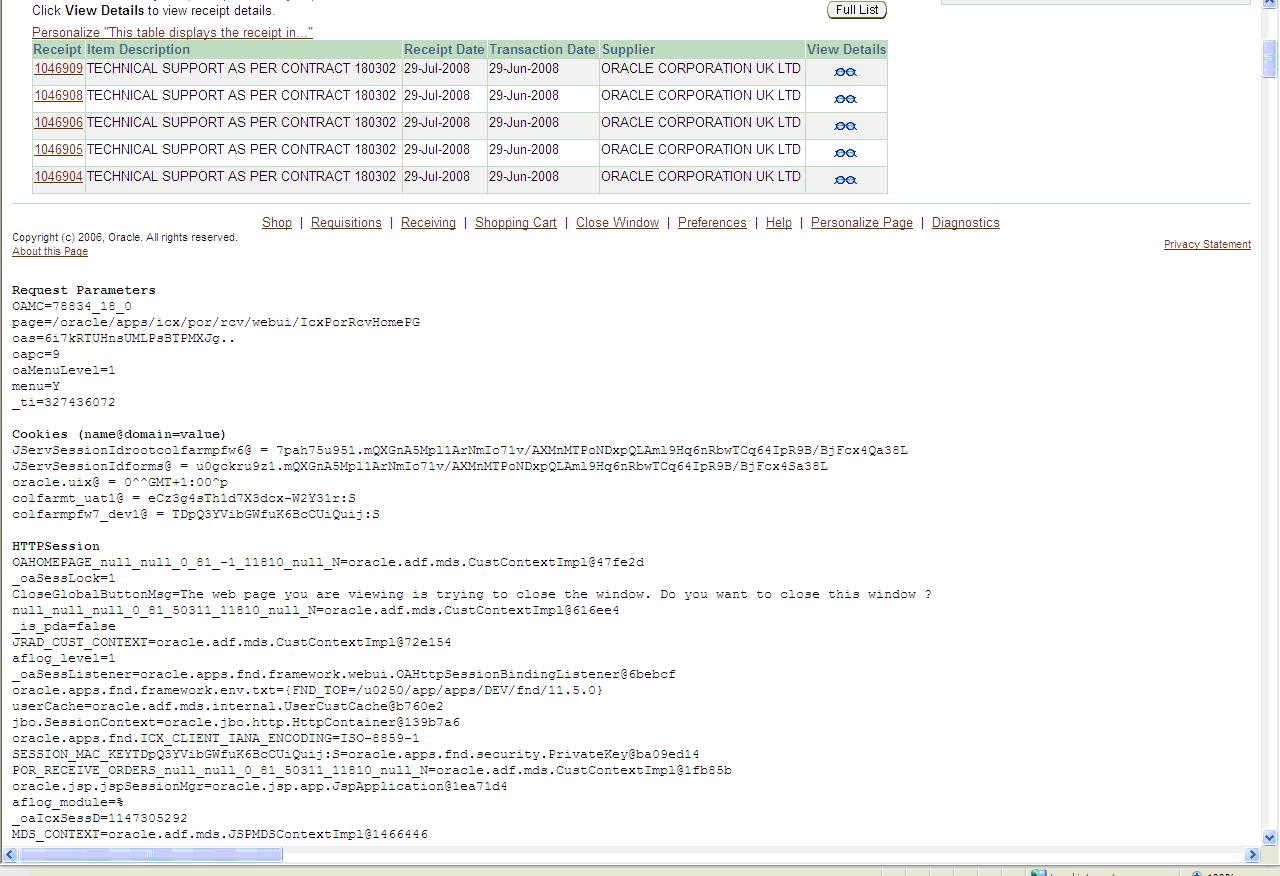
Enabling Trace in Apps
Form Tracing
I have a form where I am entering few values and then saving the form. This will have some insert and updates command in the backend which will get executed when we save the form. SQL tracing is used to track those DML queries to debug the issue.
1) Open the form and Navigate to Menu- Help -> Diagnostic -> Trace
2) Here we have many options available (default is ‘No Trace’). We can enable tracing by selecing on of the options from here. ‘Regular Trace’ gives the least information and ‘Trace with Binds and Waits’ (level 12) gives maximum information. Be careful while enabling SQL trace with wait and binds as this will make the trace file huge.
3) Also we can start the tracing in the middle of forms sessions.
4) When we enable the trace it will give the trace file location (This location will be the location of USER_DUMP_DESTINATION parameter of database)
5) After you save the form you can stop tracing by selecting ‘No Trace’ again from Help -> Diagnostic -> Trace -> No Trace
6) Finally use tkprof command to covert this raw trace file into readable format. TKPROF is explained in separate article
Report Tracing
1) Login to System Administrator responsibility and open concurrent program definition form
2) Check the 'Enable Trace' checkbox and save the program
3) In order to generate Level 12 Trace file, Navigate to Profile > System and find the profile option 'Initialization SQL Statement - Custom' for User who is submitting the process to trace. Click on User column - Edit Field and enter below statement:
begin fnd_ctl.fnd_sess_ctl('','','TRUE','TRUE','LOG','ALTER SESSION SET EVENTS=''''''10046 TRACE NAME CONTEXT FOREVER,LEVEL 12'''''); end;
Save the record.
4. Run the Concurrent program which generates the trace file on server
5. Run the following query that gives the directory where the trace file is stored.
SELECT name, value FROM v$parameter WHERE name = 'user_dump_dest';Go to the directory returned by USER_DUMP_DEST and use below command to find the file
grep -i 'CONC_REQUEST_ID=' *
Ex: grep -i 'CONC_REQUEST_ID=1499133' *
6. Finally use tkprof command to covert this raw trace file into readable format
2) Check the 'Enable Trace' checkbox and save the program
3) In order to generate Level 12 Trace file, Navigate to Profile > System and find the profile option 'Initialization SQL Statement - Custom' for User who is submitting the process to trace. Click on User column - Edit Field and enter below statement:
begin fnd_ctl.fnd_sess_ctl('','','TRUE','TRUE','LOG','ALTER SESSION SET EVENTS=''''''10046 TRACE NAME CONTEXT FOREVER,LEVEL 12'''''); end;
Save the record.
4. Run the Concurrent program which generates the trace file on server
5. Run the following query that gives the directory where the trace file is stored.
SELECT name, value FROM v$parameter WHERE name = 'user_dump_dest';Go to the directory returned by USER_DUMP_DEST and use below command to find the file
grep -i 'CONC_REQUEST_ID=
Ex: grep -i 'CONC_REQUEST_ID=1499133' *
6. Finally use tkprof command to covert this raw trace file into readable format